


How to Understand the Customer Journey and Boost Your Marketing Effectiveness
What is a customer journey?
A customer journey is the complete path of interactions a consumer has with a brand, starting from their initial awareness of the business through to the final purchase, post-sale support, and ongoing brand loyalty. In 1961, Lavidge and Steiner created ‘The Hierarchy of Effects’ model to explain customer buying behaviour, and also to help advertisers make better advertisements (1). The concept of the customer journey is essentially the flip side of the same coin.
Why bother understanding the customer journey?
| Benefits of understanding the customer journey | Marketing benefits |
| Reveals customer’s decision making thoughts, feelings, and needs at each stage | Reveals under or over performance and thus where and when to optimise or smooth the customer journey |
| Clarifies decision making influences, i. e. what are the relationship drivers or barriers (pain points) at each stage | Informs how to better communicate to engage, attract, retain customers and secure referrals, for example, through what medium, and with what messages Also how to optimise the customer or brand experience experience, e.g. through better processes. |
‘Hierarchy of effects’ model
Lavidge and Steiner’s ‘hierarchy of effects’ model comprises three stages; each has one, two or three steps. Thus six steps overall, as illustrated in Figure 1, and summarised from top to bottom, below:

- Awareness; a customer must first have a product on his or her radar before they can consider it.
- Knowledge; a customer must then have enough knowledge to ‘judge’ the product.
- Liking; third, the customer must appreciate its benefits, both rational and emotional.
- Preference for a product then follows from the thoughts and feelings thus far.
- Conviction follows when doubts are allayed and needs turned into wants. Perhaps through a product trial or demo, and also by making it easy and risk-free to buy.
- Purchase is a behaviour stage – when the customer picks a product off a shelf and hands over cash at a check-out or clicks to buy online.
The linear customer journey
Lavidge and Steiner’s model is a linear series of steps:

However, while most relevant in a world of mass advertising, in today’s online world, customer journeys are much more complex.
Understanding the customer’s journey allows marketers to determine the sequence, nature and importance of the steps, also the triggers, drivers and barriers to sales of a particular service or product. Thus, where and how to promote and add value to an offer. Also specifically how to improve trial, retention and endorsement.
It is akin to a powerful ‘sat nav’ to marketing success.
The online customer journey
However, shopping no longer takes place just in the High Street but anywhere, anytime, with the result that over 27% purchases were made online in 2023 (2). Further almost all UK adults aged 16-44 years, and 95% adults aged 16-74 years use the Internet daily. Nine out of ten also own a smartphone making it easy to go online on the go (3). Thus the ability to buy food, clothes, music, films, sports equipment, holidays, cars etc. online has never been easier.
With the growth of the online world, the customer journey has become a more complex, stepping stone process (Figure 3). Sometimes purposeful, and fast, sometimes serendipitous, looping, and seemingly never – ending. Recent research by Google Australia/New Zealand, describes this as the ‘messy middle’ (4).

Different media present different environments, and thus attract different demographics and psychographics. Further media entry points and occasions vary, and technology increasingly links from one medium to another. Of course, markets, competitive contexts and customer needs also vary. Consequently, influences differ, resulting in different customer behaviour.
Threats and opportunities for marketers
The threat to marketers is to only see digital media and only to rely on website analytics data. This only sees the effects of customer behaviour and fails to explain why they do things and what their needs are.
The opportunity is to see and understand the big picture. In particular to understand customers, in context of the entire media and competitive landscape. Where, when, how and why they behave as they do, and then to plan marketing accordingly.
How to understand your customers’ journey?
First, use qualitative research to understand the big picture, what customers do, and why? The benefit of a qualitative approach is to fully explore and understand what customers consider important, what engages, fails to engage and most importantly why? Here are some start-point (though generic) questions to ask (Figure 4).

In our experience, there are also two tracks to any customer journey; first the journey into the category, and secondly, the journey to discover, and choose a particular brand. Thus original customer research is valuable to understand the twin tracks, and also the relationships between the tracks.
It is almost impossible to predict a journey from the outside looking in, and thus research will inevitably unearth new insights.
Google’s own research suggests consumers are in sequential exploration and evaluation modes. With continuous offer selection, short-listing, and deselection until a final purchasing decision is made. They also highlight the importance of brand awareness, and the power of benefits, recommendations, and incentives to shift demand from a familiar to lesser known brand (4).
Mapping customer journeys
There are many ways to map customer journeys, and what to do should follow from your business objectives and needs. A grid matrix may best inform a new IT customer contact system, but risks the ‘wood being hidden by the trees’. A more visual representation may better help colleagues understand and act on research findings. Figure 5 (below) summarises on one page, a customer journey to research family history or family trees. It highlights key events, and drivers and barriers on the journey. It is useful in bringing to life rational and emotional factors. And thus opportunities to optimise the journey and better market brands.

How to prioritise marketing effort?
Use quantitative research to rank ‘influencing’ factors, and thus prioritise marketing effort. Though conduct qualitative research first to scope your quant survey, and finesse the questions. You’ll need to devise a long list of answers to the following:
- how customers find your brand (i.e. source(s) of awareness)
- what are key needs or reasons for considering your brand?
- what are reasons for buying or not buying your brand?
Figure 6 (below) summarises some of the results from a survey to assess key reasons (and barriers) to buying telecoms services (fixed line, mobile, broadband and TV). This shows how issues and attitudes differ across two countries. It also reveals a marketing opportunity simply to promote additional services!

Research Inspiration
- Understand the customer journey to pin-point practical marketing opportunities, and prioritise effort. Investing in research will pay quicker and larger dividends.
- Don’t under or over-estimate the impact that ‘digital’ is having on all markets. So understand both the offline and online customer journeys as well as any inter-relationships. Only then will you be able to devise strategies to exploit the linkages, address any disconnects, and optimise demand.
- The more complex and time-consuming the customer journey, the more that can go wrong. Conversely the greater the potential benefits in understanding it. For example, in business to business (B2B), writing proposals is often a key step on the journey. So unless your conversion from pitch to win is 100%, there is scope to improve! So understand and simplify where possible.
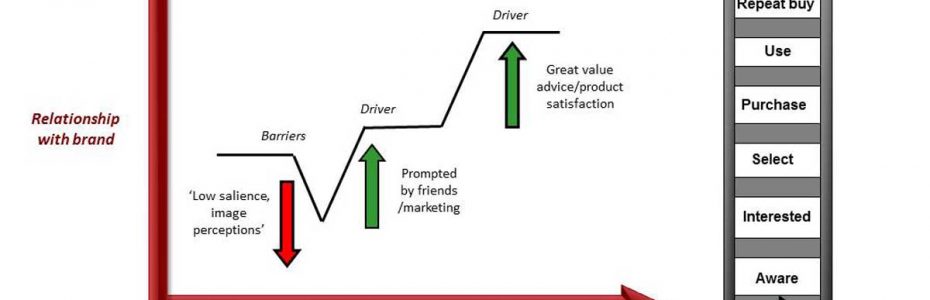
- View the whole customer journey as a relationship ladder. Your aim is to attract a prospect, win a sale, and ultimately repeat purchase and advocacy of your brand.
- Marketing basics still apply. So get your brand out there, and figure out the most compelling combination of rational and emotional benefits, and incentives to ‘activate’ demand.
Frequently asked questions
What is a customer journey?
A customer journey is the complete path of interactions a consumer has with a brand, from their initial awareness of the business or brand through to the final purchase, post-sale support, and ongoing brand loyalty and endorsement.
How is understanding the customer journey useful for marketers?
Businesses research customer journeys in order to understand drivers and barriers to business or brand discovery and engagement, in order to better invest in promotion (right place, and time), reduce friction, and improve overall customer satisfaction.
References
- Lavidge Robert J and Steiner Gary A; A Model of Predictive Measurements of Advertising Effectiveness: Journal of Marketing, vol. 25, no 6, 1961
- Office for National Statistics, UK Internet users, 2023.
- USwitch 2023
- Google Australia/New Zealand research: Decoding how consumers purchase. May 2020.
Market Research Analysis; Inspiring More Powerful Market Research

Is market research is losing its place in the boardroom?
There has been much in the press in recent years about market research losing its place in the boardroom. Most notably from Unilever who say that their senior managers are unwilling to invest time in research debriefs. An ESOMAR survey also adds that most CEOs consider market research less useful than finance, marketing, information services and human resources (1). A further BCG survey suggests that even market research professionals seem in denial about their lack of relevance (2). Yet criticism also comes from major research agencies (3). These issues appear to result from less than robust data collection, and also flimsy market research analysis and strategic interpretation.


They also trace to the research methods used and the skills of the people involved. Some say researchers lack the ability to integrate information, fail to connect research results with business outcomes, and also fail to turn complex data into clear narratives (3). Of course, concise presentations and explanations are important. But not if they result in more questions than answers. In particular, ‘so what does this mean?’.
Reliable data underpins good market research analysis
Triangulation is a mainstay market research method. The idea is that using two or more methods in a study gives more confidence in the results. Denzin defines four basic types of triangulation. Firstly, methodological triangulation. This involves using multiple research methods to gather information, such as interviews, observations, and documents. Secondly, data triangulation which involves multiple time periods and respondents. Thirdly, investigator triangulation which involves multiple researchers. And finally, theory triangulation which involves using multiple analytical methods or models (4).
Bricolage is a term used to describe multiple or multi-perspectival research methods; also a way to learn, and solve problems, by trying, testing and playing around. It avoids the reductionism in any single method (monological) and also mimetic research approaches (5 and 6). It also enables more deductive reasoning (in which a conclusion is based on the concordance of multiple premises). Lastly, it produces more comprehensive and specific insights.
Market research analysis requires experience
Qualitative research data is usually unstructured so the challenge is to manage, shape and make sense it. The most common qualitative market research analysis method is observer impression. Computers and software also classify, sort, and arrange information. Though computers and software fail to think; leaving human skill to spot themes, patterns, and thus uncover insights.
While skills and knowledge lie with the observer and analyst, for life stage and economic reasons, fieldwork and analysis tasks often fall to younger, less experienced researchers. While many are also graduates, experience is acquired mainly on the job. Thus explaining why ‘business savvy’ may be lacking.

Thinking tools enable more rigorous analysis
1. Basic ‘marketing’ provides a structure for market research analysis
Every marketer knows that customers have needs and seek products and services that offer benefits that match their needs. So to design products and services, researchers must first understand needs, and the drivers behind those needs. Only then can product benefits be matched to meet those needs. This simple marketing logic therefore helps challenge and analyse market research findings. It is therefore vital that researchers understand basic marketing principles both to uncover, analyse and interpret findings. A broad and deep know how on a businesses’ aims, as well as marketing and brand concepts, also allows broader and more penetrating enquiry. Thus inspiring more insightful, relevant, and actionable findings and conclusions.
2. Manchester map for market research analysis
Probing and testing cause and effect relationships also ensures more robust analysis. In particular, the ‘Manchester Map’ is useful technique learned in management consulting days. This involves systematically reviewing findings and then asking ‘so what does this mean?’ or ‘why does this happen?’. It also helps sort and delineate information. Thus helping understand and express findings and conclusions.

3. Quantitative techniques help sort the wheat from the chaff
Within qualitative research, employing simple numerical scoring (or semi-quantitative) techniques helps give weight to findings. Thus sorting the ‘wheat from the chaff’. We call this quali-quant research. For example, we ask respondents to choose the most appealing comms idea from a gallery. Or to rate a product concept on a scale from ‘will definitely buy’ to ‘will definitely not buy’. This reduces reliance on subjectivity (interpretivism) (7). Equally it adds scientific rigour to qualitative research i.e. objectivity (empiricism, positivism). Thus helping spot differences in meaning and relative customer appeal. In turn, spotlighting key issues and thus opportunities and ‘outliers’ (8) that demand further investigation.
Research Inspiration
- Market research has a place in the boardroom; the most successful businesses are those that truly understand their customers. Market research therefore ensures their voice is heard.
- Ensure your research works. This starts with writing a clear market research brief. Include your business aims not just what you want to know. Also seek several responses to your brief.
- Conduct due diligence. Specifically, meet the researchers who will do the work. And also ask them what they know about your business, how their market research services work. Also ask who undertakes the fieldwork, and how they analyse research.
- Demand a curious, diligent, business and marketing-savvy researcher. One therefore able to ask questions to truly understand causes and effects. And is thus able to draw conclusions and recommend practical solutions to help you.
References
1. Esomar Research World / ARF (2005)
2. Boston Consulting Group (2009)
3. Does Market Research Need inventing? www.InspectorInsight.com (2014)
4. Denzin, N. Sociological Methods: A Sourcebook. Aldine Transaction (2006)
5. Kincheloe, Joe. L. Berry, Kathleen, Rigour and Complexity in Educational Research (2005)
6. What is Mimetic Theory? www.woodybelangia.com
7. Interpretivism (or antipositivism) is a view that social research should not be subject to the same methods of investigation as the natural world. Gerber, John J. Macionis, Linda M. Sociology (7th Canadian ed.) page 32 (2010)
8. An ‘outlier’ or outlying observation deviates markedly from other members of the sample in which it occurs. Grubbs, F. E. “Procedures for detecting outlying observations in samples”, Technometrics 11 (1): 1–21 (February 1969)
Research Inspiration


This site and all contents are © The Market Researchers 2013-2026. No reproduction without permission.